example005_comparison_pyabel
This example provides a rather extensive comparison of different openAbel methods with PyAbel methods. It shows how well the main methods of openAbel perform in every regard, especially if the input data is sufficiently smooth.
Since PyAbel's focus is on the backward (or inverse) transform, this example does it as well.
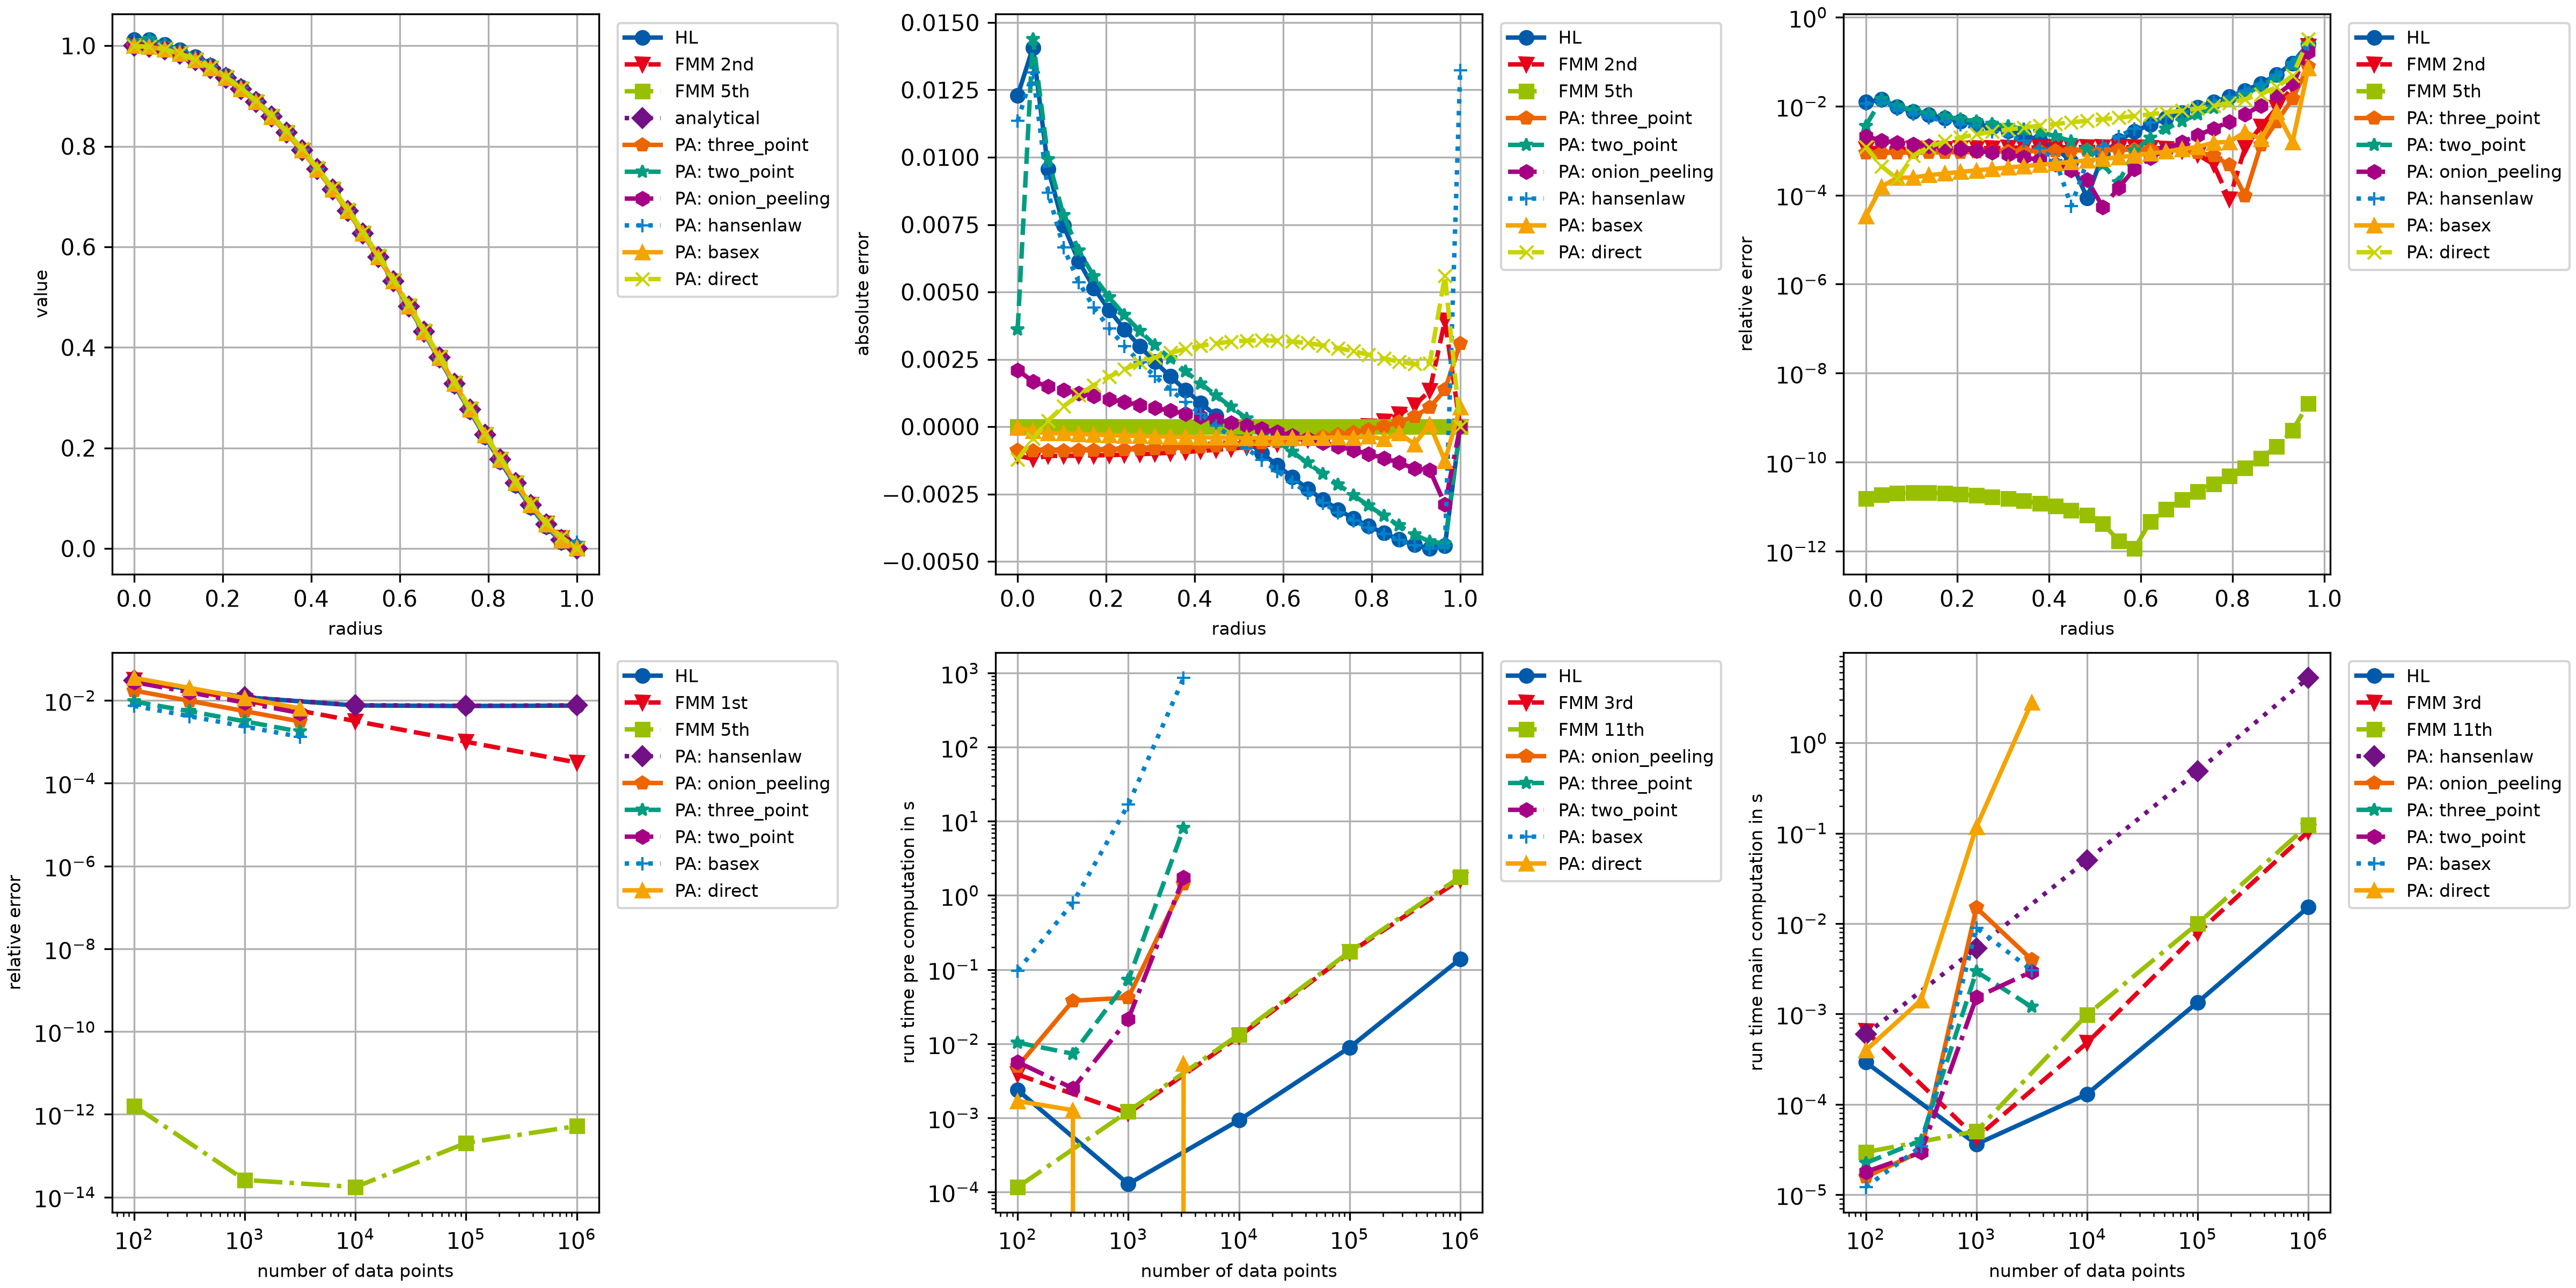
############################################################################################################################################
# Example to showcase the different openAbel methods in comparison with PyAbel methods.
# Backward transform is done here since PyAbel focuses on that.
# One obviously needs PyAbel installed for this example
############################################################################################################################################


import glob
import os
import time as ti

import abel
import matplotlib.pyplot as mpl
import numpy as np

import openabel as oa

############################################################################################################################################
# Plotting setup

params = {
    "axes.labelsize": 8,
    "font.size": 8,
    "legend.fontsize": 8,
    "xtick.labelsize": 10,
    "ytick.labelsize": 10,
    "text.usetex": False,
    "figure.figsize": [16.0, 8.0],
}
mpl.rcParams.update(params)
# Color scheme
colors = [
    "#005AA9",
    "#E6001A",
    "#99C000",
    "#721085",
    "#EC6500",
    "#009D81",
    "#A60084",
    "#0083CC",
    "#F5A300",
    "#C9D400",
    "#FDCA00",
]
# Plot markers
markers = ["o", "v", "s", "D", "p", "*", "h", "+", "^", "x"]
# Line styles
linestyles = ["-", "--", "-.", ":", "-", "--", "-.", ":", "-", "--", "-.", ":"]
lw = 2

fig, ((ax1, ax2, ax3), (ax4, ax5, ax6)) = mpl.subplots(2, 3, layout="constrained")


############################################################################################################################################
# Error over radius of different methods and orders


def error_abel(n_data, method, order):

    dx = 1.0 / (n_data - 1)
    xx = np.linspace(0.0, 1.0, n_data)

    data_in = 3.0 / 8.0 * np.pi * (1 - xx**2) ** 2
    data_ana = np.sqrt(1 - xx**2) ** 3
    abel_obj = oa.Abel(n_data, 1, 0.0, dx, method=method, order=order)
    data_out = abel_obj.execute(data_in)
    abserr = data_out - data_ana
    relerr = np.abs(abserr / np.clip(data_ana, 1.0e-300, None))

    return (xx, abserr, relerr, data_out, data_ana)


# Loop over several methods and orders
names = ["HL", "FMM 2nd", "FMM 5th"]
orders = [-1, 2, 5]
methods = [1, 3, 3]

for ii in range(len(orders)):
    (xx, abserr, relerr, data_out, data_ana) = error_abel(30, methods[ii], orders[ii])
    ax1.plot(
        xx,
        data_out,
        label=str(names[ii]),
        color=colors[ii],
        linestyle=linestyles[ii],
        marker=markers[ii],
        linewidth=lw,
    )
    ax2.plot(
        xx,
        abserr,
        label=str(names[ii]),
        color=colors[ii],
        linestyle=linestyles[ii],
        marker=markers[ii],
        linewidth=lw,
    )
    ax3.semilogy(
        xx[:-1],
        relerr[:-1],
        label=str(names[ii]),
        color=colors[ii],
        linestyle=linestyles[ii],
        marker=markers[ii],
        linewidth=lw,
    )

ii += 1
ax1.plot(
    xx,
    data_ana,
    label="analytical",
    color=colors[ii],
    linestyle=linestyles[ii],
    marker=markers[ii],
    linewidth=lw,
)


def error_pyabel(n_data, method, function):

    dx = 1.0 / (n_data - 1)
    xx = np.linspace(0.0, 1.0, n_data)

    data_in = 3.0 / 8.0 * np.pi * (1 - xx**2) ** 2
    data_ana = np.sqrt(1 - xx**2) ** 3
    data_out = function(data_in, basis_dir=".", dr=dx, direction="inverse")
    abserr = data_out - data_ana
    relerr = np.abs(abserr / np.clip(data_ana, 1.0e-300, None))

    return (xx, abserr, relerr, data_out, data_ana)


jj = ii + 1
# Loop over several methods and orders
methods = [
    "three_point",
    "two_point",
    "onion_peeling",
    "hansenlaw",
    "basex",
    "direct",
]
functions = [
    abel.dasch.three_point_transform,
    abel.dasch.two_point_transform,
    abel.dasch.onion_peeling_transform,
    abel.hansenlaw.hansenlaw_transform,
    abel.basex.basex_transform,
    abel.direct.direct_transform,
]
for ii in range(len(methods)):
    (xx, abserr, relerr, data_out, data_ana) = error_pyabel(30, methods[ii], functions[ii])
    ax1.plot(
        xx,
        data_out,
        label="PA: " + str(methods[ii]),
        color=colors[jj + ii],
        linestyle=linestyles[jj + ii],
        marker=markers[jj + ii],
        linewidth=lw,
    )
    ax2.plot(
        xx,
        abserr,
        label="PA: " + str(methods[ii]),
        color=colors[jj + ii],
        linestyle=linestyles[jj + ii],
        marker=markers[jj + ii],
        linewidth=lw,
    )
    ax3.semilogy(
        xx[:-1],
        relerr[:-1],
        label="PA: " + str(methods[ii]),
        color=colors[jj + ii],
        linestyle=linestyles[jj + ii],
        marker=markers[jj + ii],
        linewidth=lw,
    )


ax1.legend(loc="upper left", bbox_to_anchor=(1.02, 1.0))
ax1.set_xlabel("radius")
ax1.set_ylabel("value")
ax1.grid(True)

ax2.legend(loc="upper left", bbox_to_anchor=(1.02, 1.0))
ax2.set_xlabel("radius")
ax2.set_ylabel("absolute error")
ax2.grid(True)

ax3.legend(loc="upper left", bbox_to_anchor=(1.02, 1.0))
ax3.set_xlabel("radius")
ax3.set_ylabel("relative error")
ax3.grid(True)

#############################################################################################################################################
# Convergence of different methods


def convergence_abel(n_array, method, order):

    conv = np.empty(n_array.shape[0])
    for ii in range(n_array.shape[0]):
        n_data = n_array[ii]
        dx = 1.0 / (n_data - 1)
        xx = np.linspace(0.0, 1.0, n_data)

        data_in = 3.0 / 8.0 * np.pi * (1 - xx**2) ** 2
        abel_obj = oa.Abel(n_data, 1, 0.0, dx, method=method, order=order)
        data_out = abel_obj.execute(data_in)
        data_ana = np.sqrt(1 - xx**2) ** 3

        conv[ii] = np.sqrt(np.sum(((data_out[:-1] - data_ana[:-1]) / data_ana[:-1]) ** 2) / (n_data - 1))

    return conv


# Loop over several methods and orders
names = ["HL", "FMM 1st", "FMM 5th"]
orders = [-1, 1, 5]
methods = [1, 3, 3]
n_array = 10 ** (np.arange(5) + 2)

for ii in range(len(orders)):
    conv = convergence_abel(n_array, methods[ii], orders[ii])
    ax4.loglog(
        n_array,
        conv,
        label=str(names[ii]),
        color=colors[ii],
        linestyle=linestyles[ii],
        marker=markers[ii],
        linewidth=lw,
    )


def convergence_pyabel(n_array, method, function):

    conv = np.empty(n_array.shape[0])
    for ii in range(n_array.shape[0]):
        n_data = n_array[ii]
        dx = 1.0 / (n_data - 1)
        xx = np.linspace(0.0, 1.0, n_data)

        data_in = 3.0 / 8.0 * np.pi * (1 - xx**2) ** 2
        data_out = function(data_in, basis_dir=".", dr=dx, direction="inverse")
        data_ana = np.sqrt(1 - xx**2) ** 3

        conv[ii] = np.sqrt(np.sum(((data_out[:-1] - data_ana[:-1]) / data_ana[:-1]) ** 2) / (n_data - 1))

    return conv


jj = ii + 1
# Loop over several methods
methods = ["hansenlaw", "onion_peeling", "three_point", "two_point", "basex", "direct"]
functions = [
    abel.hansenlaw.hansenlaw_transform,
    abel.dasch.onion_peeling_transform,
    abel.dasch.three_point_transform,
    abel.dasch.two_point_transform,
    abel.basex.basex_transform,
    abel.direct.direct_transform,
]
for ii in range(1):
    conv = convergence_pyabel(n_array, methods[ii], functions[ii])
    ax4.loglog(
        n_array,
        conv,
        label="PA: " + str(methods[ii]),
        color=colors[jj + ii],
        linestyle=linestyles[jj + ii],
        marker=markers[jj + ii],
        linewidth=lw,
    )

n_array = (10 ** (np.arange(4) * 0.5 + 2) + 0.5).astype(int)
for ii in range(1, len(methods)):
    conv = convergence_pyabel(n_array, methods[ii], functions[ii])
    ax4.loglog(
        n_array,
        conv,
        label="PA: " + str(methods[ii]),
        color=colors[jj + ii],
        linestyle=linestyles[jj + ii],
        marker=markers[jj + ii],
        linewidth=lw,
    )


ax4.legend(loc="upper left", bbox_to_anchor=(1.02, 1.0))
ax4.set_xlabel("number of data points")
ax4.set_ylabel("relative error")
ax4.grid(True)


#############################################################################################################################################
# Run times of different methods and orders


def runtimes_abel(n_array, n_measure, method, order):

    runtimes = np.zeros(n_array.shape[0])
    runtimes_pre = np.zeros(n_array.shape[0])

    for ii in range(n_array.shape[0]):
        data_in = np.ones(n_array[ii])
        timings = np.empty(n_measure)
        for jj in range(n_measure):
            t0 = ti.time()
            abel_obj = oa.Abel(n_array[ii], 1, 0.0, 1.0, method=method, order=order)
            t1 = ti.time()
            timings[jj] = t1 - t0
        runtimes_pre[ii] = np.sum(timings) / n_measure

        abel_obj = oa.Abel(n_array[ii], 1, 0.0, 1.0, method=method, order=order)
        t0 = ti.time()
        for jj in range(n_measure):
            data_out = abel_obj.execute(data_in)
        t1 = ti.time()

        runtimes[ii] = (t1 - t0) / n_measure

    return (runtimes_pre, runtimes)


# Loop over several methods and orders
names = ["HL", "FMM 3rd", "FMM 11th"]
orders = [-1, 3, 11]
methods = [1, 3, 3]
n_array = 10 ** (np.arange(5) + 2)

for ii in range(3):
    (runtimes_pre, runtimes) = runtimes_abel(n_array, 1, methods[ii], orders[ii])
    ax5.loglog(
        n_array,
        runtimes_pre,
        label=str(names[ii]),
        color=colors[ii],
        linestyle=linestyles[ii],
        marker=markers[ii],
        linewidth=lw,
    )
    ax6.loglog(
        n_array,
        runtimes,
        label=str(names[ii]),
        color=colors[ii],
        linestyle=linestyles[ii],
        marker=markers[ii],
        linewidth=lw,
    )

n_array = 10 ** (np.arange(4) + 2)
for ii in range(3, len(names)):
    (runtimes_pre, runtimes) = runtimes_abel(n_array, 1, methods[ii], orders[ii])
    ax5.loglog(
        n_array,
        runtimes_pre,
        label=str(names[ii]),
        color=colors[ii],
        linestyle=linestyles[ii],
        marker=markers[ii],
        linewidth=lw,
    )
    ax6.loglog(
        n_array,
        runtimes,
        label=str(names[ii]),
        color=colors[ii],
        linestyle=linestyles[ii],
        marker=markers[ii],
        linewidth=lw,
    )


def runtimes_pyabel(n_array, n_measure, method, function):

    runtimes = np.zeros(n_array.shape[0])
    runtimes_pre = np.zeros(n_array.shape[0])

    for ii in range(n_array.shape[0]):
        data_in = np.ones(n_array[ii])
        timings = np.empty(n_measure)
        for jj in range(n_measure):
            for filename in glob.glob(method + "*"):
                os.remove(filename)
            t0 = ti.time()
            data_out = function(data_in, basis_dir=".", dr=1.0, direction="inverse")
            t1 = ti.time()
            timings[jj] = t1 - t0
        runtimes_pre[ii] = np.sum(timings) / n_measure

        t0 = ti.time()
        for jj in range(n_measure):
            data_out = function(data_in, basis_dir=".", dr=1.0, direction="inverse")
        t1 = ti.time()

        runtimes[ii] = (t1 - t0) / n_measure
        runtimes_pre[ii] -= runtimes[ii]

    return (runtimes_pre, runtimes)


jj = ii + 1
# Loop over several methods
methods = ["hansenlaw", "onion_peeling", "three_point", "two_point", "basex", "direct"]
functions = [
    abel.hansenlaw.hansenlaw_transform,
    abel.dasch.onion_peeling_transform,
    abel.dasch.three_point_transform,
    abel.dasch.two_point_transform,
    abel.basex.basex_transform,
    abel.direct.direct_transform,
]
n_array = 10 ** (np.arange(5) + 2)
for ii in range(1):
    (runtimes_pre, runtimes) = runtimes_pyabel(n_array, 1, methods[ii], functions[ii])
    ax6.loglog(
        n_array,
        runtimes,
        label="PA: " + str(methods[ii]),
        color=colors[jj + ii],
        linestyle=linestyles[jj + ii],
        marker=markers[jj + ii],
        linewidth=lw,
    )

n_array = (10 ** (np.arange(4) * 0.5 + 2) + 0.5).astype(int)
for ii in range(1, len(methods)):
    (runtimes_pre, runtimes) = runtimes_pyabel(n_array, 1, methods[ii], functions[ii])
    ax5.loglog(
        n_array,
        runtimes_pre,
        label="PA: " + str(methods[ii]),
        color=colors[jj + ii],
        linestyle=linestyles[jj + ii],
        marker=markers[jj + ii],
        linewidth=lw,
    )
    ax6.loglog(
        n_array,
        runtimes,
        label="PA: " + str(methods[ii]),
        color=colors[jj + ii],
        linestyle=linestyles[jj + ii],
        marker=markers[jj + ii],
        linewidth=lw,
    )

ax5.legend(loc="upper left", bbox_to_anchor=(1.02, 1.0))
ax5.set_xlabel("number of data points")
ax5.set_ylabel("run time pre computation in s")
ax5.grid(True)

ax6.legend(loc="upper left", bbox_to_anchor=(1.02, 1.0))
ax6.set_xlabel("number of data points")
ax6.set_ylabel("run time main computation in s")
ax6.grid(True)


mpl.savefig("example005_comparison_pyabel.png", dpi=300)

mpl.show()